In this post I will focus on one Trade setup used in sales orders which is the behavior of the Delivery Date Control when CTP is chosen. The Delivery Date Control manage the calculation of delivery date...(read more)![]()
↧
Usage of CTP value for Delivery Date Control
↧
Pricing Options in Dynamics 365 for Finance and Operations
Pricing Options in Dynamics 365 for Finance and Operations
There are several different ways to enter pricing of a particular material in Dynamics 365 Finance and Operations , depending on the client’s nature of business. In this blog post, I will list ...read more![]()
↧
↧
D365Tour Press review – May 2018
D365Tour Press review- May 2018
"At Microsoft we make #TechForGood by empowering every French citizen to achieve more." Satya Nadella
...(read more)![]()
↧
Production and advanced warehousing in D365FO using backflushing and manufacturing execution: State of the union
Two functional areas of
Microsoft Dynamics 365 for Finance and Operations (D365FO), Production and
Advanced Warehousing, were not the greatest friends in the beginning, as some
of the readers will know from experience. But things have improved quite ...read more![]()
↧
Dynamics 365 for Finance and Operations. Static IP Addresses?
We received many requests regarding the IP addresses used by production environments of Dynamics 365 for Finance and Operations in the cloud. There might be multiple reasons for those requests: configure services and devices, allow access from the company’s network or simply monitor the availability. This blog is written to demystify some wrong assumptions. Can...![]()
↧
↧
D365FO – Some nice excel tricks
When working with importing master data into Dynamics 365 you will experience that they are available in different data entities. In a typical retail project you would need to import data like released products, item barcodes, external item numbers price. It is also common that we get the master data in many files and in different formats. It is therefore quite beneficial to know a few tricks so that it becomes easer to work with loads of data. Here are my tips.
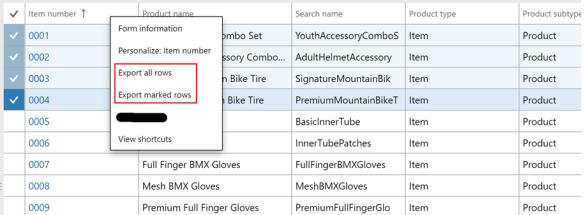
Export all/selected rows (You should know this!)
From any grid in D365FO you can export selected/all rows to excel by right clicking on the grid. The tip is therefore to make a personalization to the grid, so that it contains the fields you want to export to excel.
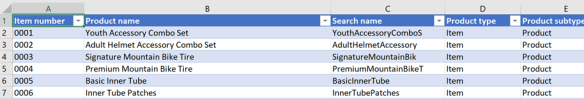
Then Excel opens with the selected columns. (PS! This export is limited to 10.000 rows)
Use excel to create a filter
Let’s say we have a excel spread sheet with item numbers, and want to filter in D365FO on these items. Here is a very valuable tip.
- Copy the items column from excel and paste as rows in a new excel sheet.(Transpose)

- Then copy the row, and paste into notepad
![]()
- Then do a search, replace in notepad, where you copy the space/tab and replace it with comma (,)
![]()
![]()
- Then copy the content here and use it on a “match” filter in D365FO
![]()
- Then you have created a filter on the selected field. It seams the “match” filer is capable of handling quite a lot of text.
![]()


This is nice when some asks you to “Please fix these 200 items”. You then filter them and quite quickly go through them to fix it.
Learn Excel VLOOKUP
VLOOKUP is essential to learn, because it let’s you check and lookup data across multiple excel sheet. A typical scenario in the retail world is when the vendor sends a new pricelist, and you want to import them. Often this is delivered as a excel sheet with the vendor item number, item barcode and the price. Most retailers prefers to have their own item numbers. But then you have the issue of mapping the item barcode from the vendor pricelist and trying to find your own product number. Here is how I recommend my customers to do it:
- Export all D365FO item barcodes to excel (There is an entity for this, or open the barcodes from the retail menu)
- In the vendor excel price list, create a VLOOKUP field to lookup the D365FO product number based on the item barcode.
![]()
- Then you can create an excel sheet where you have your own product number, and you can import them using “open in excel” or through a data management import job.

Happy weekend friends !
↧
#365SaturdayMadrid: #MSDyn365FO & Dispositivos IoT… ¡Conéctalo como puedas!
¡Por fin llegó! Como ya sabéis, el pasado 19 de Mayo tuvo lugar en las oficinas de Microsoft Ibérica el evento Dynamics 365 Saturday Madrid . Pues bien, hoy podemos decir que este evento ya está disponible...(read more)![]()
↧
Continuous / automated build setup on a non-Main Branch
In case you are setting up automated build , for a Local VM by default this will force to create a new branch named as Main and will setup build for Main Branch. Does not matter if you are not doing development...(read more)![]()
↧
Extensibility: You can now log extensibility requests for Microsoft through LCS
If you weren't living under a rock for the last 2 years, you have already heard about us locking down overlayering starting with the latest release of Dynamics 365 for Finance and Operations 8.0, and relying solely on the extension model of developing customizations going forward.
But, of course, as this is a moving target, not everything can be done through extensions in the current release.![]()
![]()
↧
↧
How to get Worker’s Dependent Dynamics Ax 2012 R3
Here is small and quick tip. Couple of Days ago I helped a developer to get Dependent out of worker.
Microsoft provide a View DirPartyRelationshipsUnionView. Here Worker Party Id is saved as “otherParty” and dependent Party id can be found as ” SELFPARTY”.
Quick SQL query is below,
select name from DIRPARTYTABLE where recid in (
select SELFPARTY from DirPartyRelationshipsUnionView where OTHERPARTY =5637146826)
↧
Create Microsoft Dynamics 365 for Finance and Operations – Extensibility requests in LCS
Some months ago, Microsoft Connect was retired in favor of new tools and services to engage with Microsoft. The only feature we were still missing is creating Extensibility support request to enable extension scenarios and this feature is now enabled in Lifecycle Services. Use the Support tile in your Dynamics 365 for Finance and Operations...![]()
↧
Creating a business app in PowerApps for Microsoft dynamics 365 for Finance and Operations.
In this blog post we will try to build out our own business app using PowerApps.
Imagine how cools is that just designing and building a business app in Microsoft PowerApps without writing code, just...(read more)![]()
↧
D365: Management Reporter – How to build the Trial balance report
The trial balance is an internal report run at the end of an accounting period, listing the ending balance in each account. The report is primarily used to ensure that the total of all debits equals the...(read more)![]()
↧
↧
MSDW Podcast News Roundup: CSP updates; Dynamics 365 Business Central rollout; Flow expansion; Partner mergers
On this episode we bring back the Dynamics community news
roundup, with a little of everything, from Dynamics 365 product plans to
partner challenges to leading edge tech and community profiles. And we
welcome MSDW assistant editor Eamon McCarthy Earls ...read more![]()
↧
Transfer Order or Transfer Journal? And What is the Difference Anyway?
Transfer Order or Transfer Journal? And What is the Difference Anyway?
It is very important to understand that Dynamics 365 for Finance and Operations offers two distinct functionalities for moving inventory between inventory dimensions. That is right ...read more![]()
↧
Utilisation de la méthode CTP
English version available here
Dans cet article on va s’intéresser à un paramètre utilisé dans les commandes de vente qui s’appelle la Vérification de la date de livraison, en particulier avec la valeur...(read more)![]()
↧
How to use Environment Monitoring View Raw Logs
This document explains how to use the "view raw logs" feature in LCS environment monitoring for your Cloud Dynamics 365 for Finance and Operations environments, this is the ability for you to look at some of the various telemetry data we record from your environments (for example slow queries) to give you insight into issues you might have, or crucially to react proactively before anyone notices there's an issue.
So what is this view raw logs?
Physically "view raw logs" is a button in LCS which shows you various telemetry data taken from your environment, things like long running queries. In the background this is surfacing telemetry data gathered from the environment - for all Microsoft-hosted cloud environments we're gathering telemetry data constantly. This is via instrumentation in our application, we are gathering a huge number of rows per hour from a busy environment. We store this in a Big Data solution in the cloud, this is more than just a SQL Database somewhere, as we are quite literally gathering billions and billions of rows per day, it's a pretty special system.
Timings - how quickly does it show in LCS and long is it kept for?
There is approximately a 10 minute delay between capturing this data from an environment and being able to view it in LCS.
Data is available in LCS for 30 days - so you always have a rolling last 30 days.
A few limitations/frequently asked questions
- Is it available for on-premises? Not available for on-premises and not on the roadmap yet. This feature relies on uploading telemetry data to Microsoft cloud, so it doesn't feel right for on-premises.
- Is it available for ALL other environments? It's available for environments within your Implementation project - so Tier1-5 environments and Production. It's not available for environments you download or host on your own Azure subscription.
- Doesn't Microsoft monitor and fix everything for me so I don't need to look at anything? This can be a sensitive subject; Microsoft are monitoring production, and will contact you if they notice an issue which you need to resolve (that's quite new). Customer/Partner still own their code, and Microsoft won't change your code for you. During implementation and testing, you're trying to make sure all is good before you go-live, this is useful during that period too. So the reality is it's a little bit on all parties.
- Is there business data shown/stored in telemetry? No. From a technical perspective this does mean things like user name and infolog messages are not shown, which as a Developer is annoying, but understandable.
Where to find view raw logs?
From your LCS project, click on "Full details" next to the environment you want to view, a new page opens, then scroll to the bottom of the page and click "Environment monitoring" link, a new page opens, click "view raw logs" button (towards the right hand side), now you're on the View raw logs page!
Here's a walkthrough:


Explanation of the search fields
See below:
How to use "search terms" for a query?
This field allows you to search for any value in any column in the report. A common example would be looking for an Activity ID from an error message you get, for example:
An activity ID can be thought of as the ID which links together the log entries for a particular set of actions a user was taking – like confirming a PO. If you add a filter on this in the “All logs” query, as below, then you’ll see all logs for the current activity the user was performing – this is showing all events tagged with that activityId.
Tell me what each query does!
All logs
All logs
This query can be used to view all events for a giving user’s activity ID. If a user had a problem and saved the activity ID for you, then you can add it in the “search terms” box in this query and see all events for the process they were performing at the time. The exceptionMessage and exceptionStacktrace are useful for a Developer to understand what may have caused a user’s issue, these are populated when the TaskName= AosXppUnhandledException
All error events
This is a version of “All logs” which is filtered to only show TaskName=CliError, which means Infolog errors. There is only one column available on this report which isn’t already available in “All logs” which is eventGroupId, which serves no practical purpose. It is not possible to identify which users had the errors (user isn't captured directly on this TaskName). It is not possible to see the Infolog message shown to the user (because it could have contained business data so can't be captured). The callstack column shows the code call stack leading to the error.
User login events
This shows when user sessions logged on and off. The user IDs have been anonymized as GUIDs so to track them back to actual users, in the "Users" form inside Dynamics look at the "telemetry ID" field, on environments where you have database access you can look in the USERINFO table at OBJECTID. The report is pre-filtered to show 7 days activity from the end date of your choosing. There is a maximum limit of 10000 rows, the report isn’t usable if you have over 10k in 10 days.
This report could be useful to make statistics about the number of unique users using the system per day/week/month, by dumping the results to excel and aggregating it.
Error events for a specific form
This shows all TaskName=CliError (Infolog errors) for a specific form name you search for. The form name is the AOT name of the form, e.g. TrvExpenses, not the name you see on the menu, e.g. Expenses.
The call stack is visible for any errors found. This can be useful when users are reporting problems with a particular form, but they haven't given you an ActivtyId from an error message - using this query you can still find errors/call stacks related to the form.
Slow queries
This shows all slow queries for a time period. SQL query and call stack is shown. The Utilization column is the total estimated time (AvgExecutionTimeinSeconds * ExecutionCount) – we're calling it "estimated" because it’s using the average execution time and not the actual time. Queries over 100ms are shown.
This one is one of my favourites, it's very useful to run after a set of testing has completed to see how query performance was. A Developer can easily see where long queries might be coming from (because SQL and call stack are given) and take action.
SQL Azure connection outages
Shows when SQL Azure was unavailable. This is very rare though, I've never seen it show any data.
Slow interactions
Ironically the "slow interactions" query takes a long time to run! The record limit isn’t respected on this query – it shows all records regardless. This means if you try to run it for longer periods it’ll fail with “query failed to execute” error message as the result set is too large, run it in small date ranges to prevent this.
This one includes the slow query data I mentioned earlier, and also more form related information, so what this one can give you is a rough idea of the buttons a user pressed (or I should say form interactions to be more technically correct) leading up to the slow query. If you're investigating a slow query, looking for it here will give you a bit more context about the form interactions.
Is batch throttled
This shows whether batches were throttled. Batch throttling feature will prevent new batches from running temporarily if the resource limits set within the batch throttling feature are exceeded - this is to try and limit the resources that a batch process can use, to ensure that sufficient resources are available for user sessions. The infoMessage column in this report shows which resource was exceeded.
Generally speaking you shouldn't hit the throttling limits - if you see data in here, it's likely you have a runaway batch job on your hands - find out which one and look at why it's going crazy.
Financial reporting daily error summary
Shows an aggregated summary of errors from the Financial Reporting processing service (used to be called Management Reporter). This gives you a fast view if anything is wrong with Financial Reporting, this is hard-coded to filter for today, but as processing runs every 5 minutes in the background that is ok. Typically use this if a user reports something is wrong/missing in Financial Reporting, to get a quick look at if any errors are being reported there.
Financial reporting long running queries
This shouldn't return any data normally - it might do if a reset has been performed on Financial reporting and it's rebuilding all of it's data. Generally for customers and partners I would recommend not to worry about this one, it's more for Microsoft's benefit.
Financial reporting SQL query failures
Again this one shouldn't return data normally. This helps to catch issues such as, when copying databases between environments if change tracking has been re-enabled, then Financial reporting will be throwing errors when it tries to make queries against change tracking.
Financial reporting maintenance task heartbeat
The Financial reporting service reports a heartbeat once a minute to telemetry to prove it's running ok. This report shows that data summarized - so it has 1 row per hour, and should show 60 count for each row (i.e. one per minute). This allows you to see if the service is running and available. Note that the report doesn't respect the row limit, but as it's aggregated it doesn't cause a problem.
Financial reporting data flow
For those of you familiar with the old versions of Financial Reporting (or management reporter), this is similar to the output you used to get in the UI of the server app, where you can see the various integration tasks and whether they ran ok, and how many records they processed. This is useful for checking if the integration is running correctly or if one of the jobs is failing. Note that this query also ignores the row limit, so run it for a shorter time period or it'll run for a long time.
Financial reporting failed integration records
I'd skip this one, it's showing just the timestamp and name for each integration task (similar to the "Financial reporting data flow" query above, but with less information), the name suggests it shows only failures, but actually it shows all rows regardless. Use the "Financial reporting data flow" query instead.
All events for activity
You can skip over this one - it's very similar to the "All logs" query – but it also has SQL server name and SQL database name, which are irrelevant as you’ve already chosen an environment to view it so you know which server and database it is.
All crashes
This shows AOS crashes, it tells you is how many crashes there were but it’s not directly actionable from here. If you have data here, log a support ticket with Microsoft - on the Microsoft side we have more data available about the crash which means it is actionable. Microsoft are proactively investigating crash issues we see through telemetry. Keeping up to date on platform updates helps prevent seeing crashes.
All deadlocks in the system
The title of this query is odd "in the system", ahh thanks for clarifying I thought it was all deadlocks in the world. This shows SQL deadlocks, and gives the SQL statement and call stack. You can use this similarly to the "Slow queries" query, for example after a round of testing has completed, review this log to check whether the tested code was generating deadlocks anywhere - and if it is then investigate the related X++ code.
Error events for activity
This is a filtered versions of the query “All events for activity” showing only errors, which itself is a version of "All logs" - it means if you've been given an ActivityId you could use this one to jump straight to only the error events relating to that activity - whereas "All logs" would show you errors + other data.
Distinct user sessions
This one shows, for each user, how many sessions they’ve had during a time period. You could use this to look at user adoption of the environment - the number of unique users per day/week/month - see if users are actually using it. It is similar to "User login events", just aggregated.
All events for user
This one is named in a confusing way – really it is showing user interaction events for a user – so it’ll show you everything a user pressed in forms in the time period. The tricky thing is that user IDs are obfuscated so you need to find the GUID for the user first – look it up in the "Users" form inside Dynamics. You might use this to see what a particular user was doing during a period, if you're trying to reproduce something they've reported and the user isn't being very forthcoming with information. The information shown here is a little difficult to interpret, it's very much Developer focused.
All events for browser session
This allows you to look up results using the session ID from an error message - remember right at the beginning of this article the screenshot about how to use the ActivityId from an error message - well also in that message was a "Session ID" this query let's you show logs for the session. Imagine an Activity ID is a set of related events within a session, and a Session ID is the overarching session containing everything while the user was logged in that time.
Find the official page on Monitoring and Diagnostics here.
↧
↧
How to link SQL SPID to user in Dynamics 365 for Finance and Operations on-premises
Quick one today! How to link a SQL SPID back to a Dynamics user in Dynamics 365 for finance and operations on-premises. You use this when, for example, you have a blocking SQL process, and you want to know which user in the application triggered it - this allows you to look up the blocking SPID and find out which user.
Run this SQL:
select cast(context_info as varchar(128)) as ci,* from sys.dm_exec_sessions where session_id > 50 and login_name = 'axdbadmin'
First column, shows the Dynamics user. It's much like it was in AX2012, except you don't need to go set a registry key first.
You can do the same thing in the Cloud version, but there you don't need to do it in TSQL because in LCS you can go to Monitoring and "SQL Now" tab where you can see SPID to user for running SQL.
↧
Microsoft Dynamics 365 for Finance and Operations: Inventory consignment process
In this blog post we are going to review consignment scenario where vendor sends the inventory to the company but vendor retains ownership until the consumption. It could be production consumption or sale...(read more)![]()
↧
What is a DTU?
If you are logged into the Unify Portal and navigate to Kusto actions > Performance > Perf Metric, you will be presented with the DTU Timeline, which details DTU consumption. But what exactly is a DTU? A DTU, or Database Transaction Unit, is a blended measure of CPU, memory, and disk resources. This does not...![]()
↧